Behind the work
01—0701Mise by Fogato
App · UX/UI design
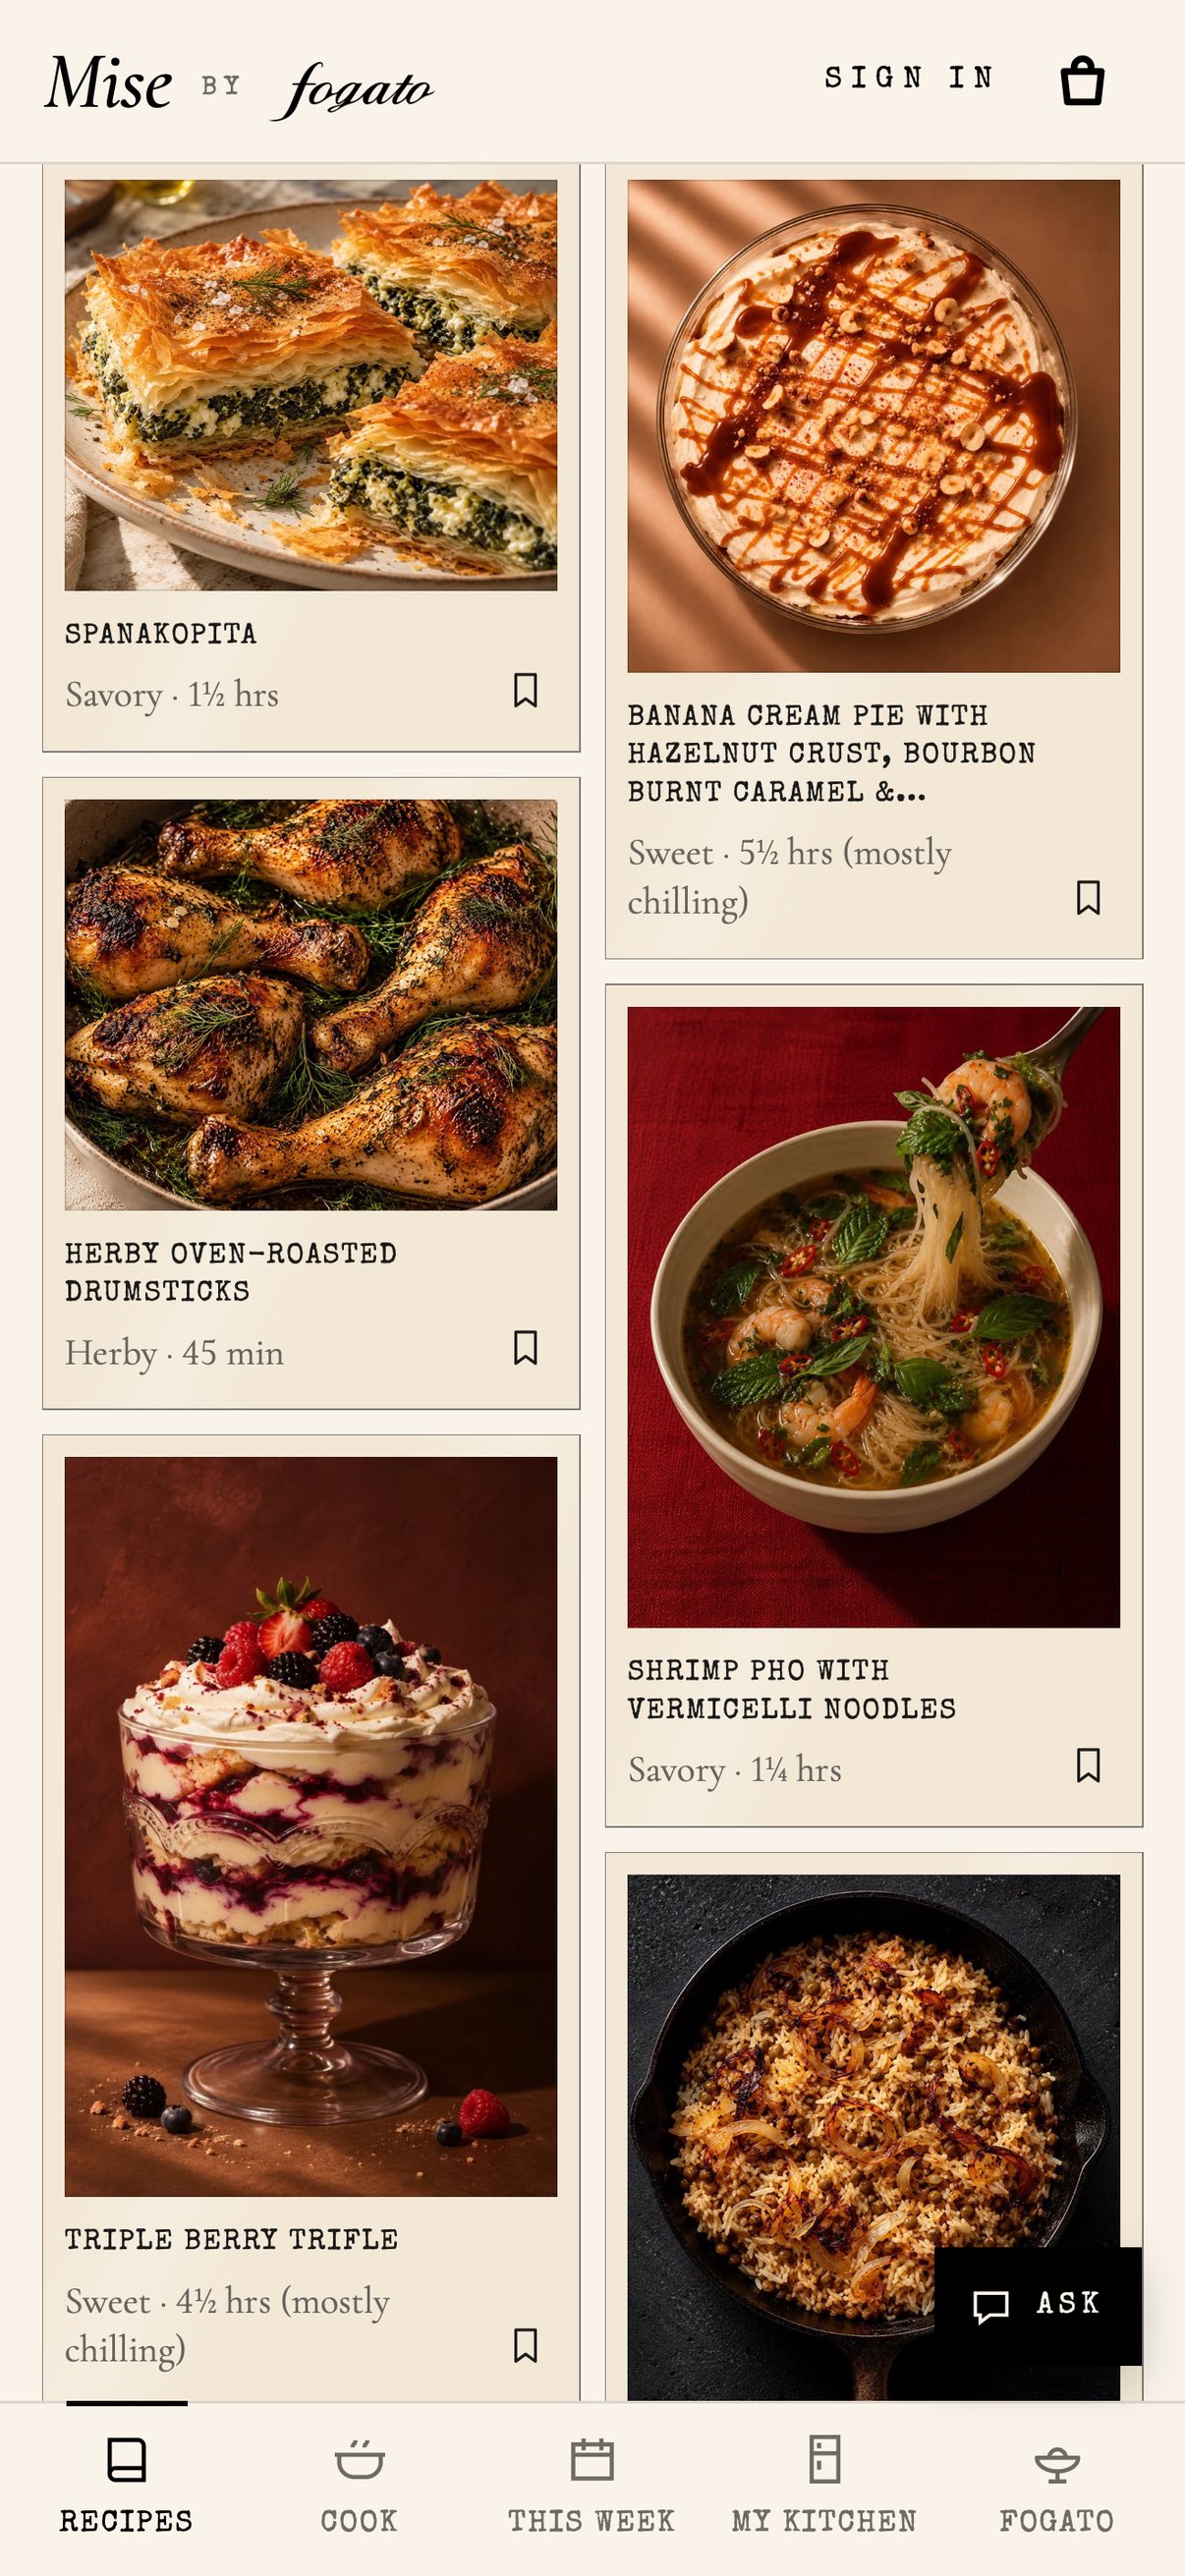
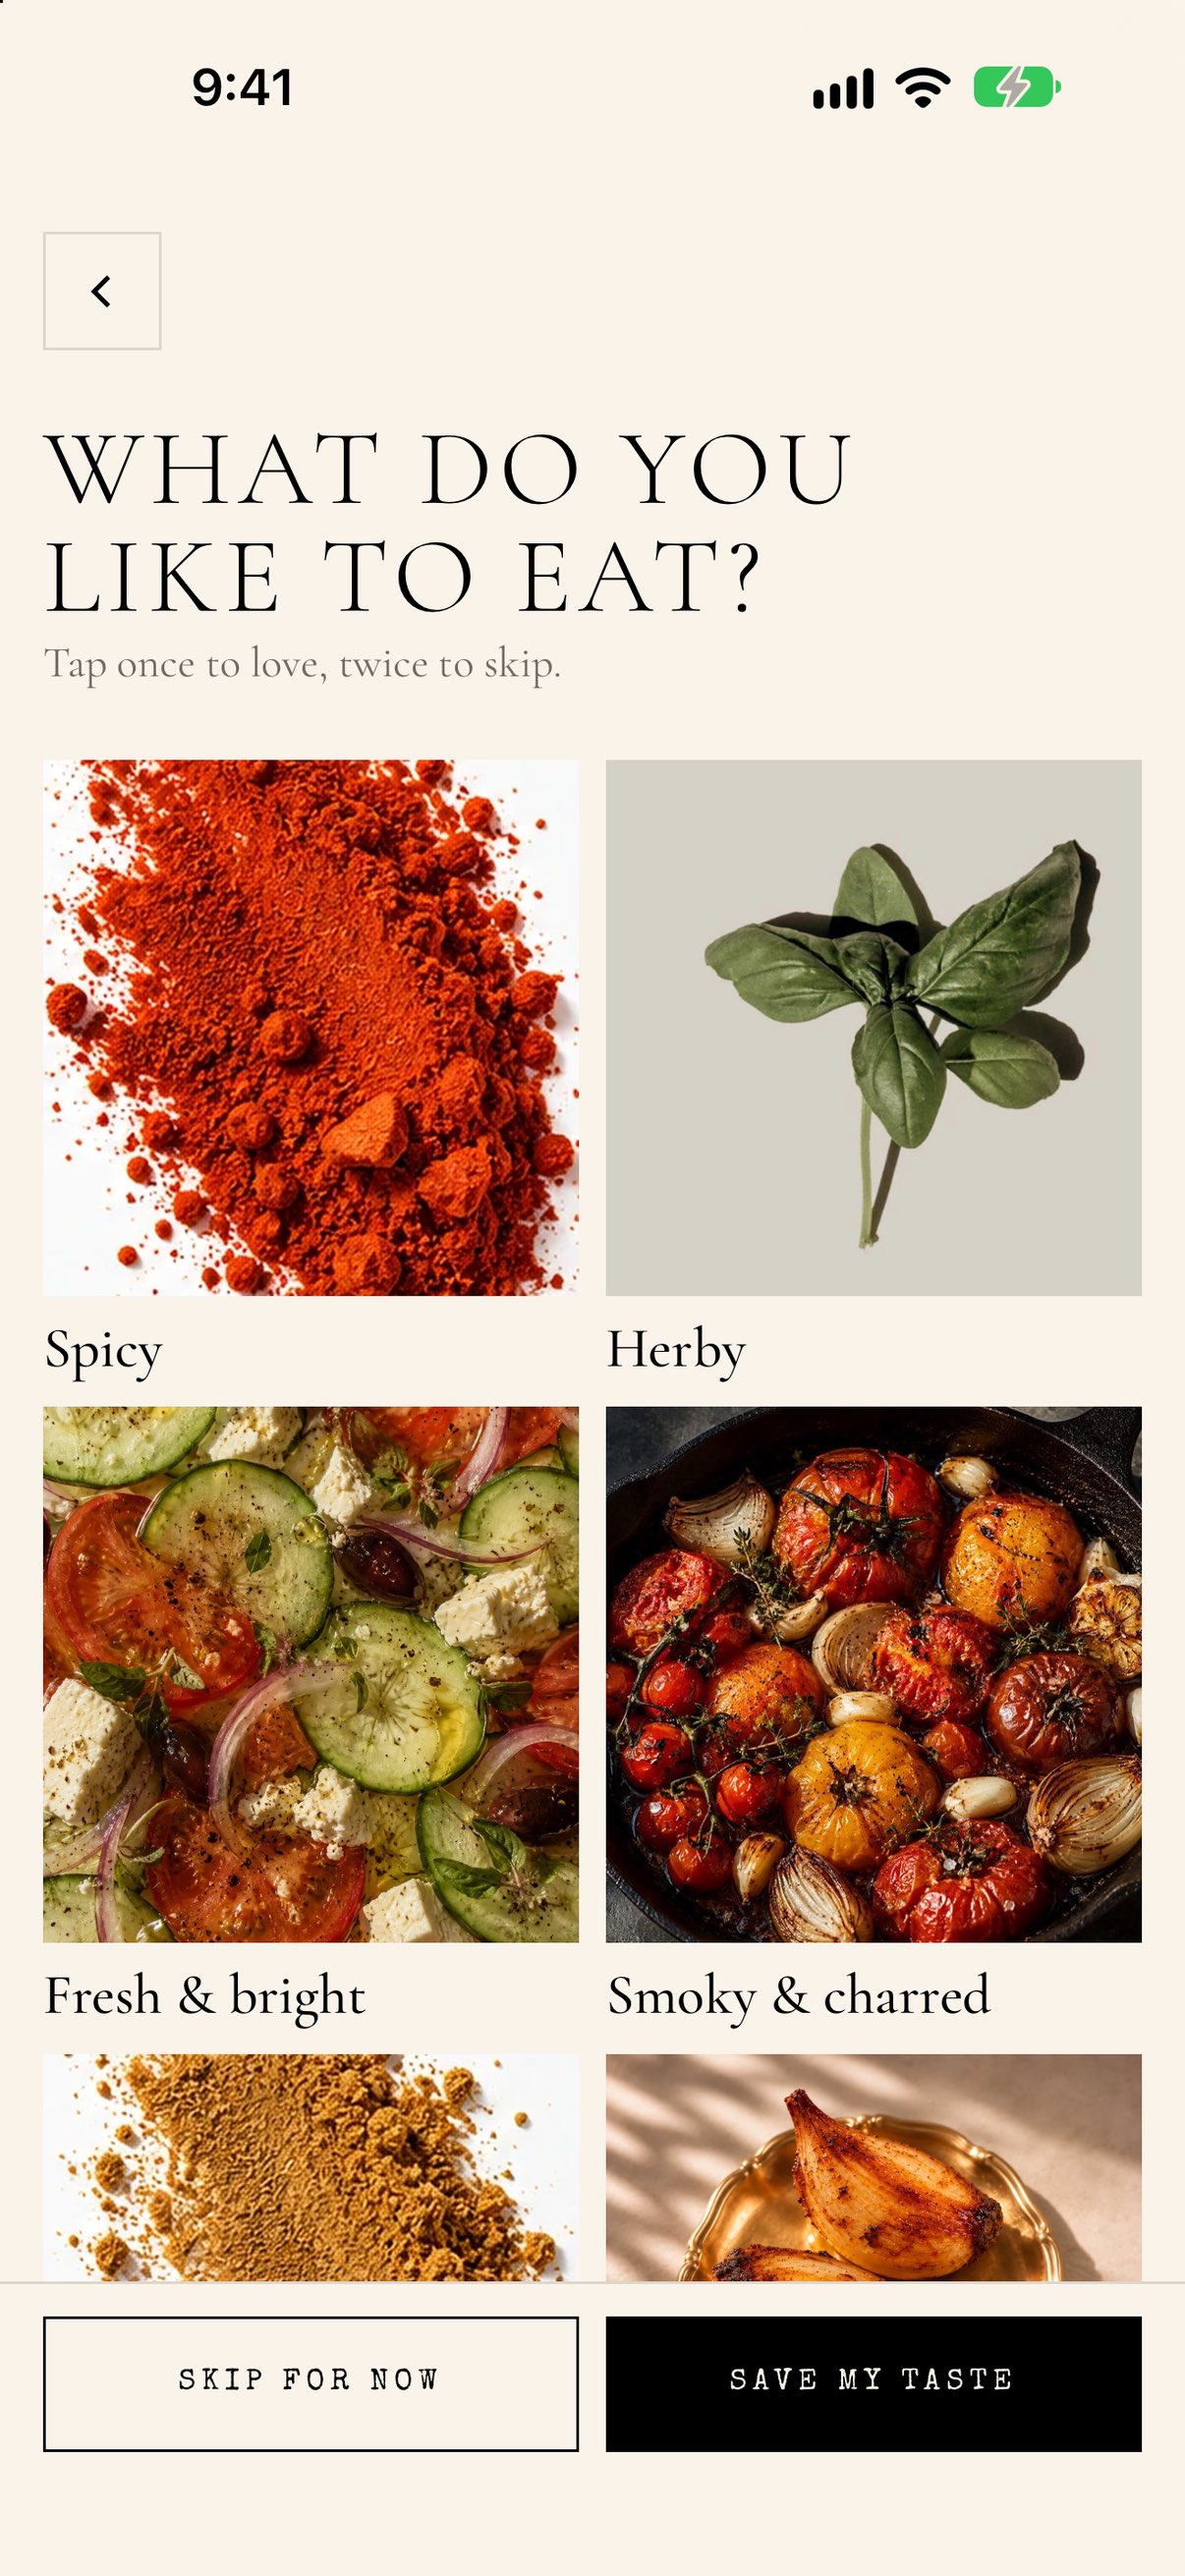
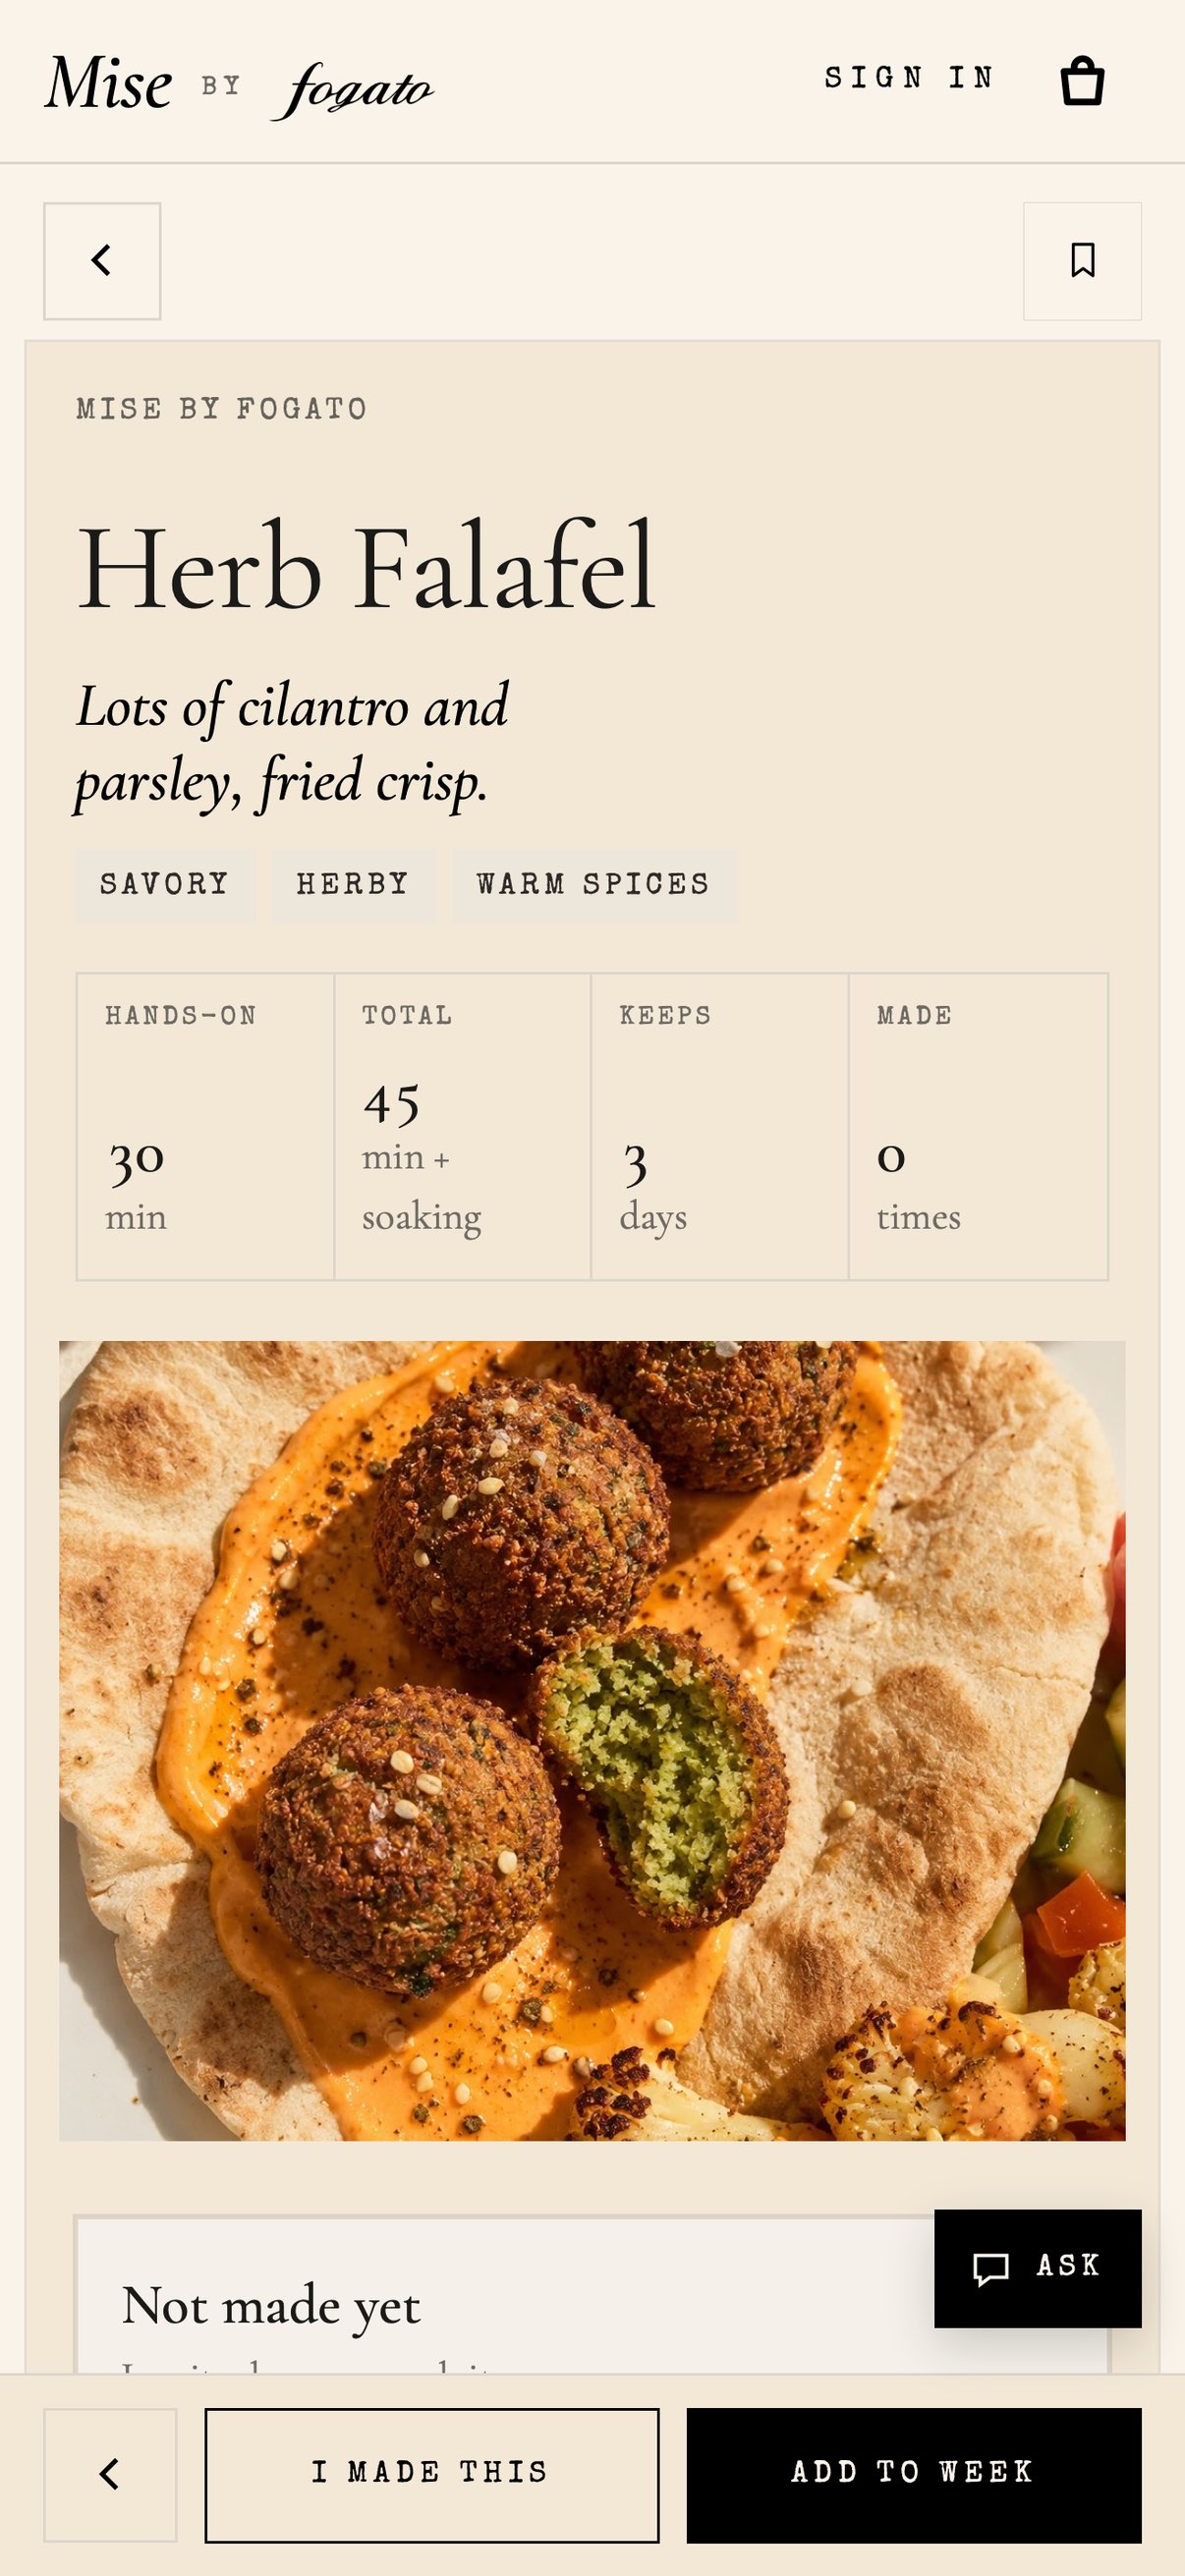
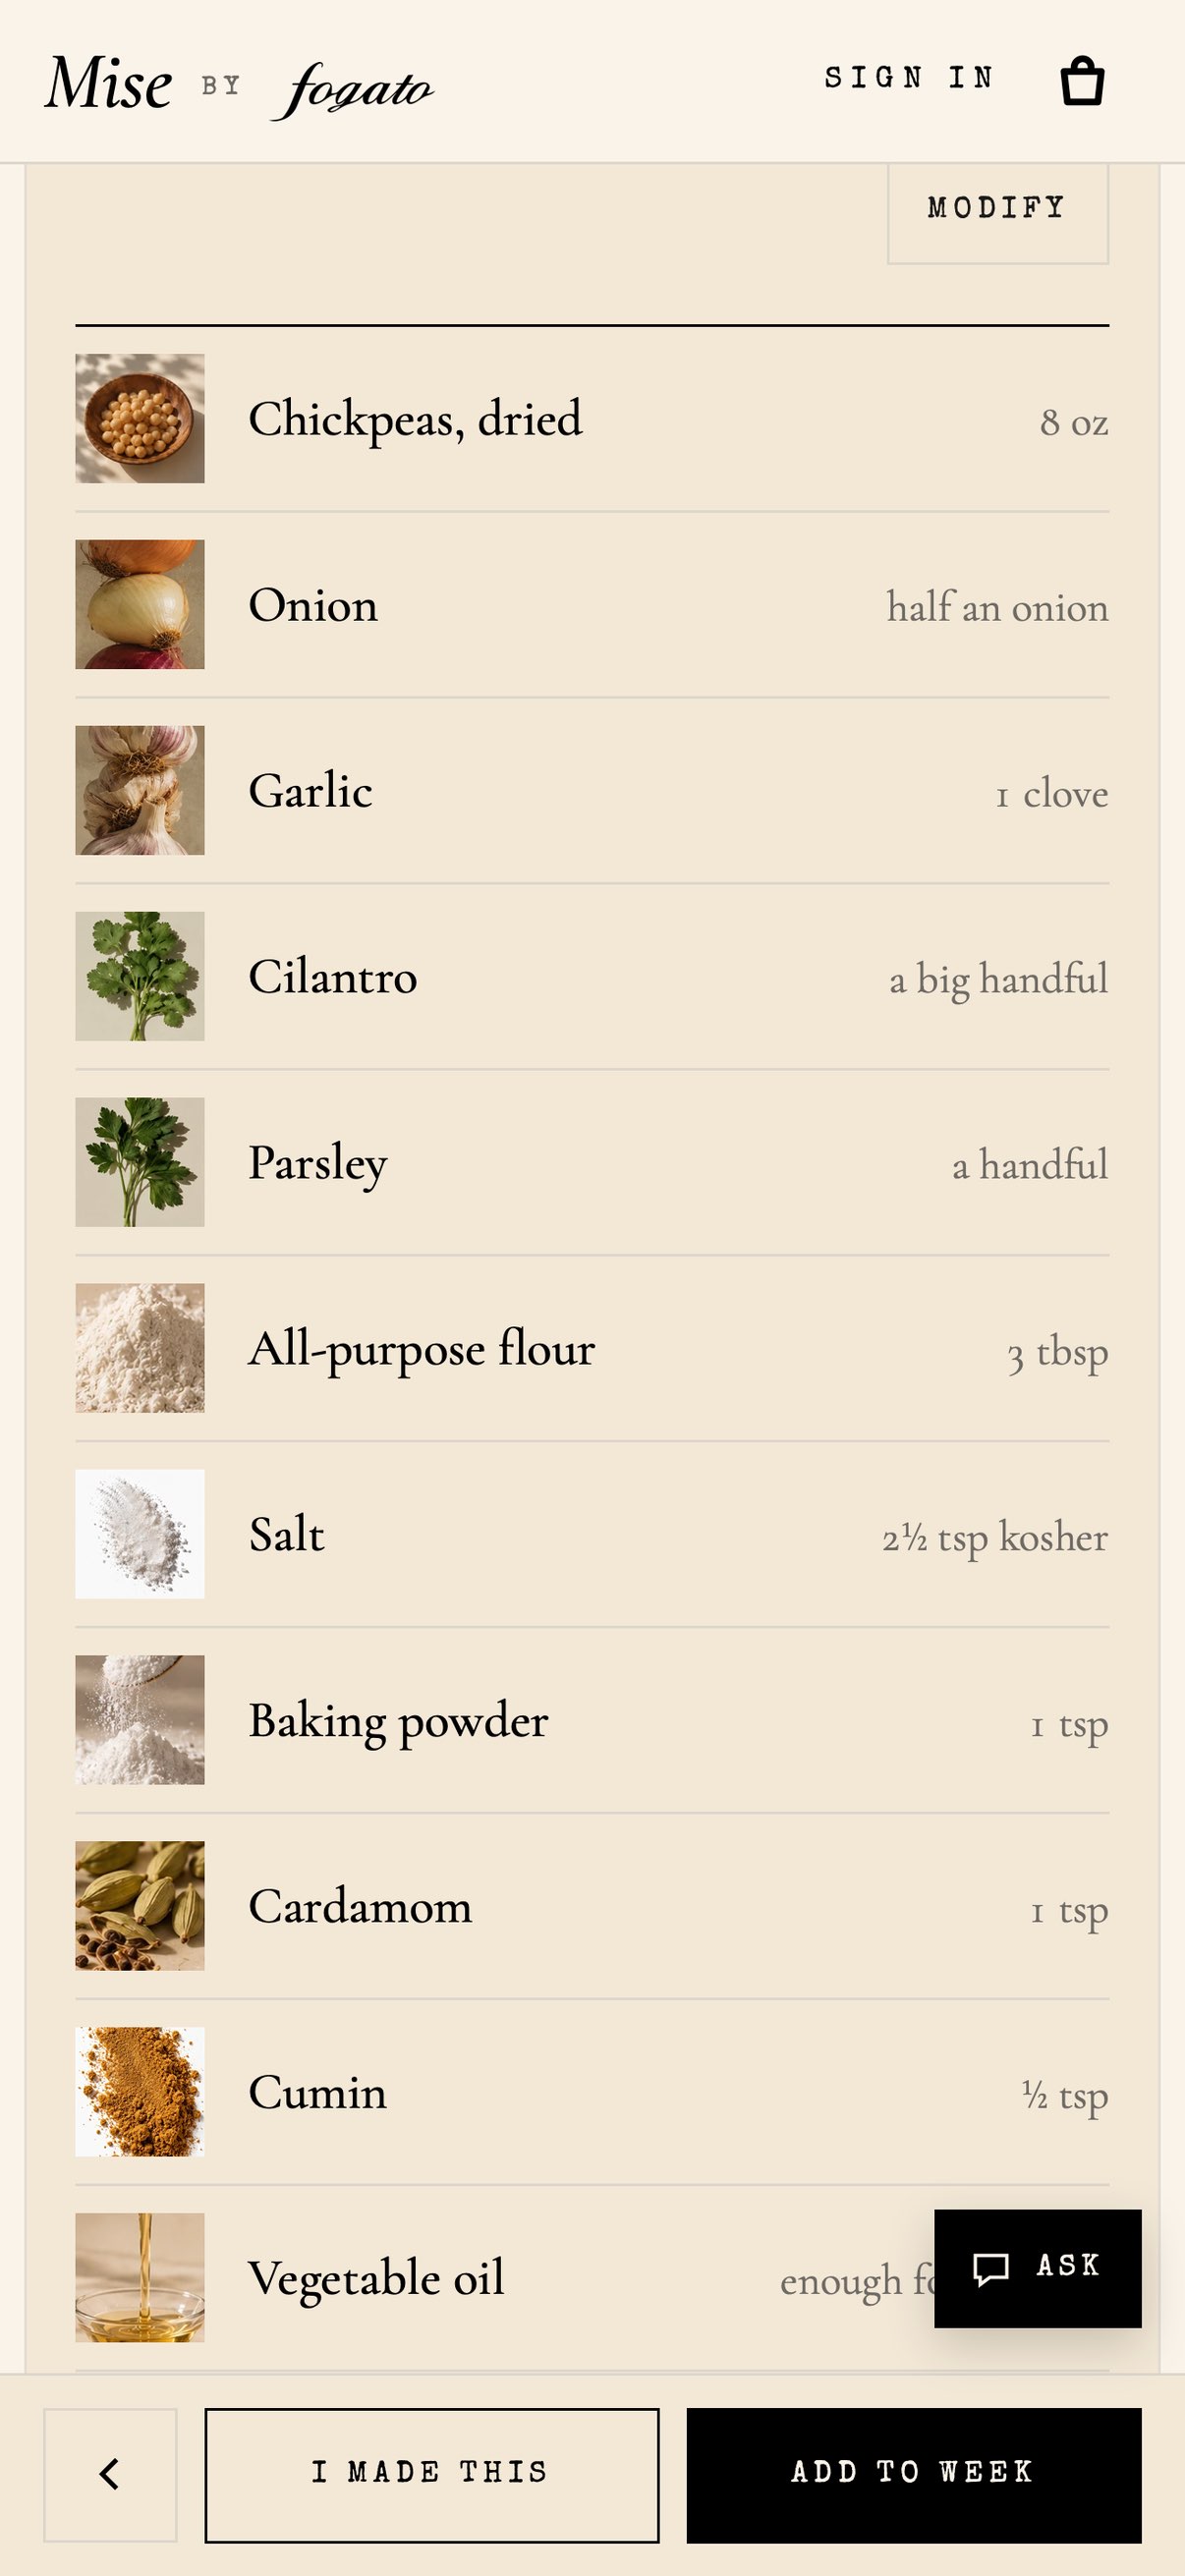
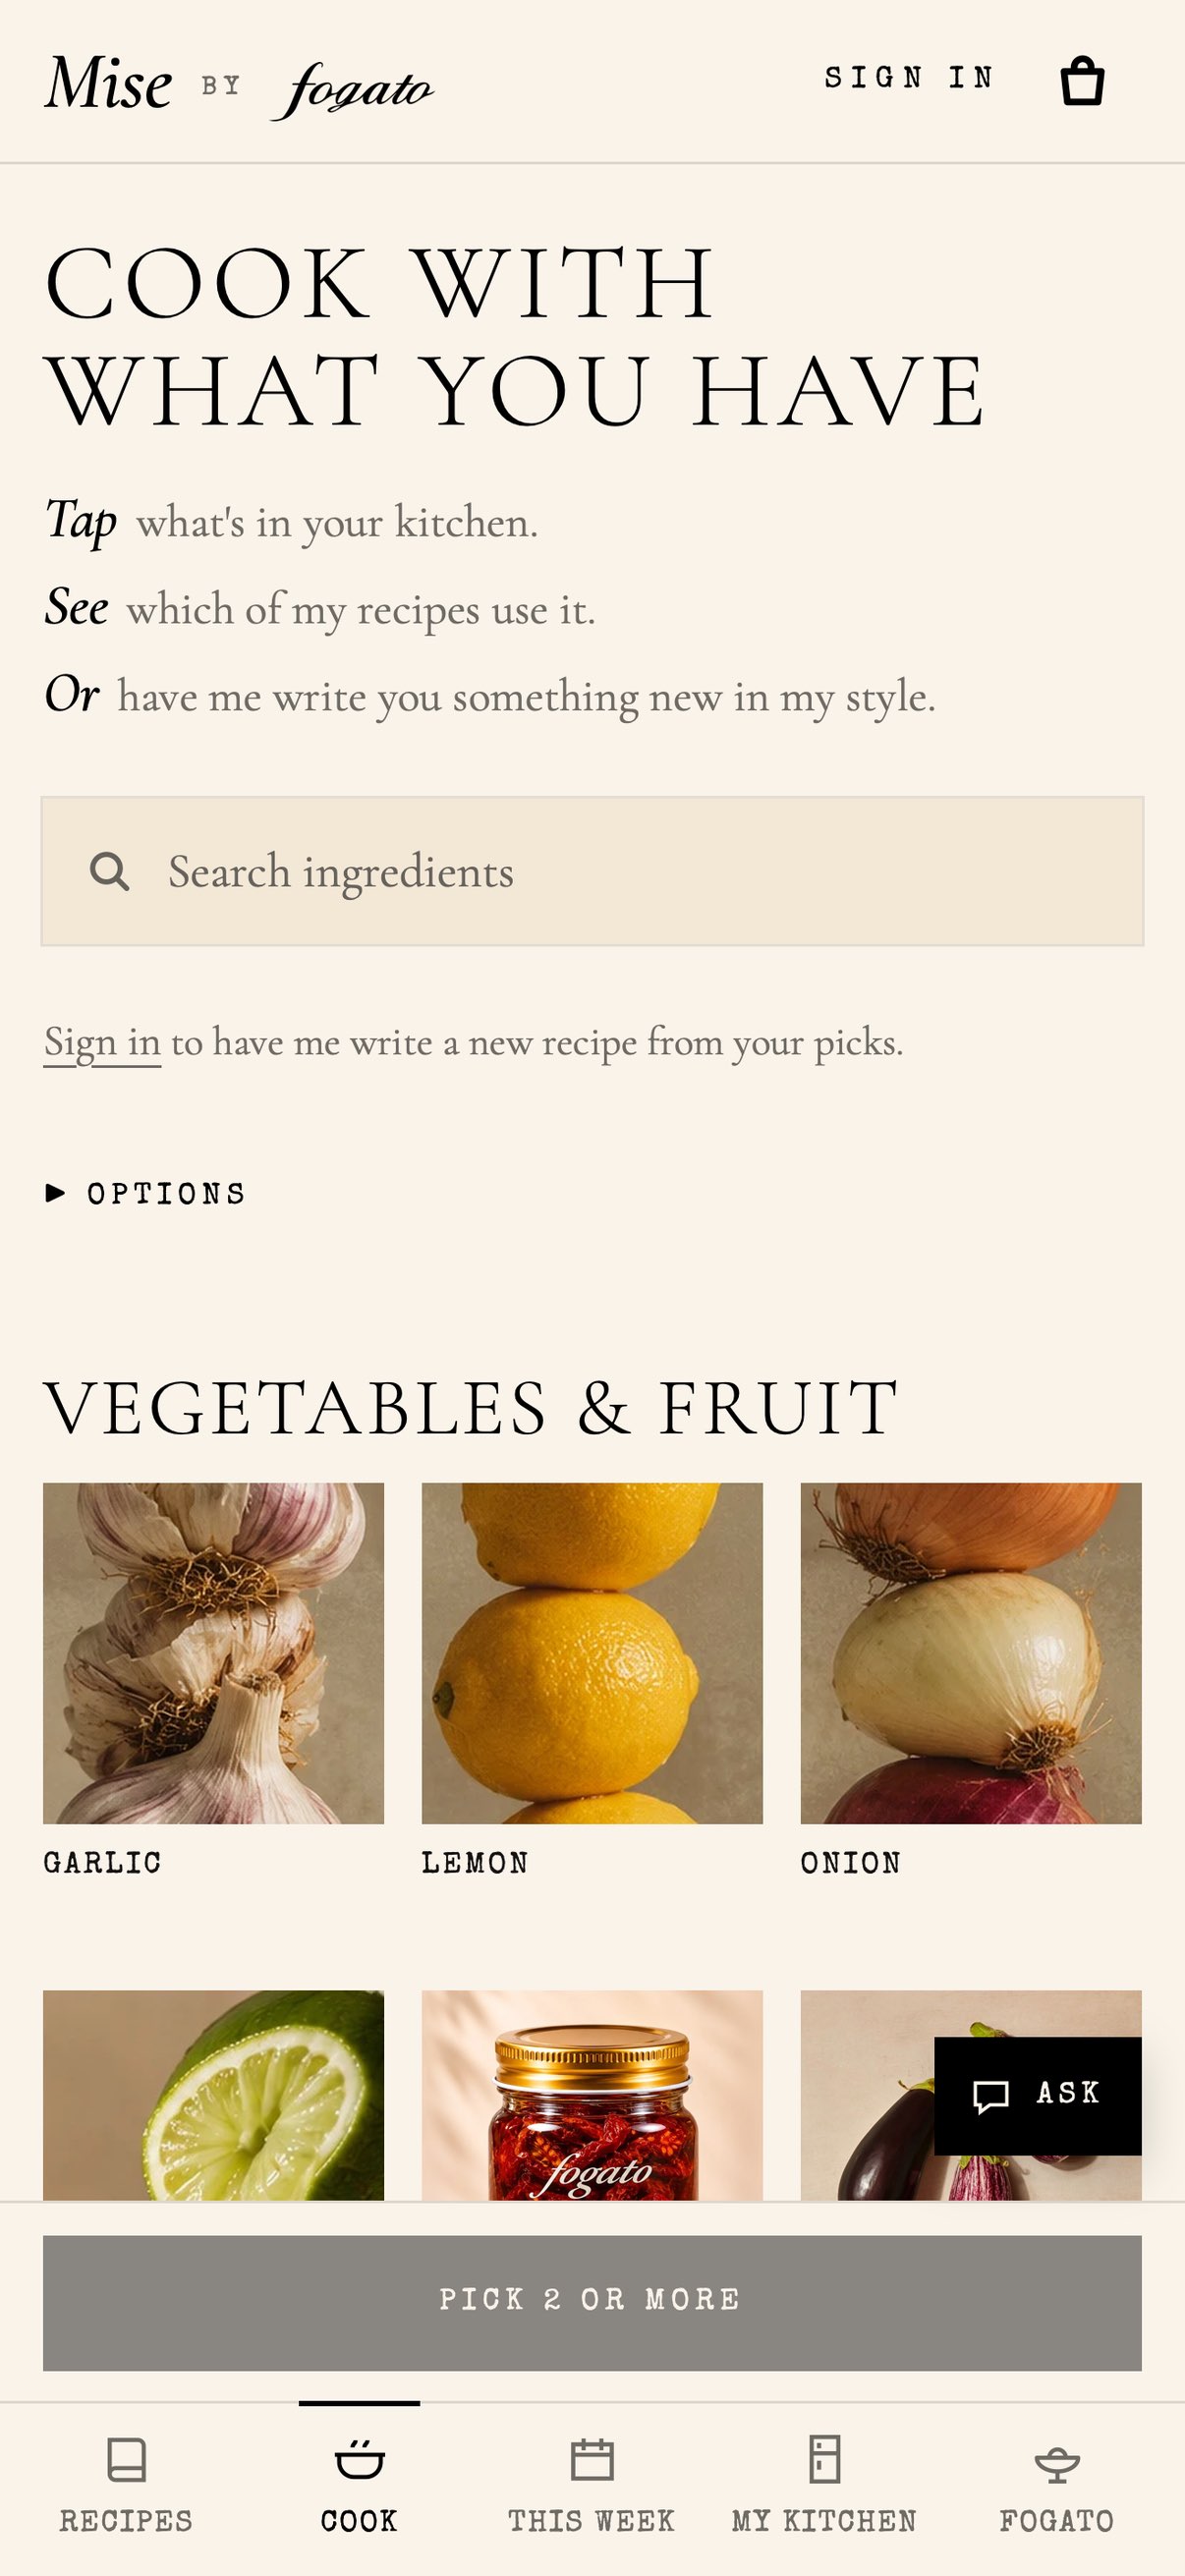
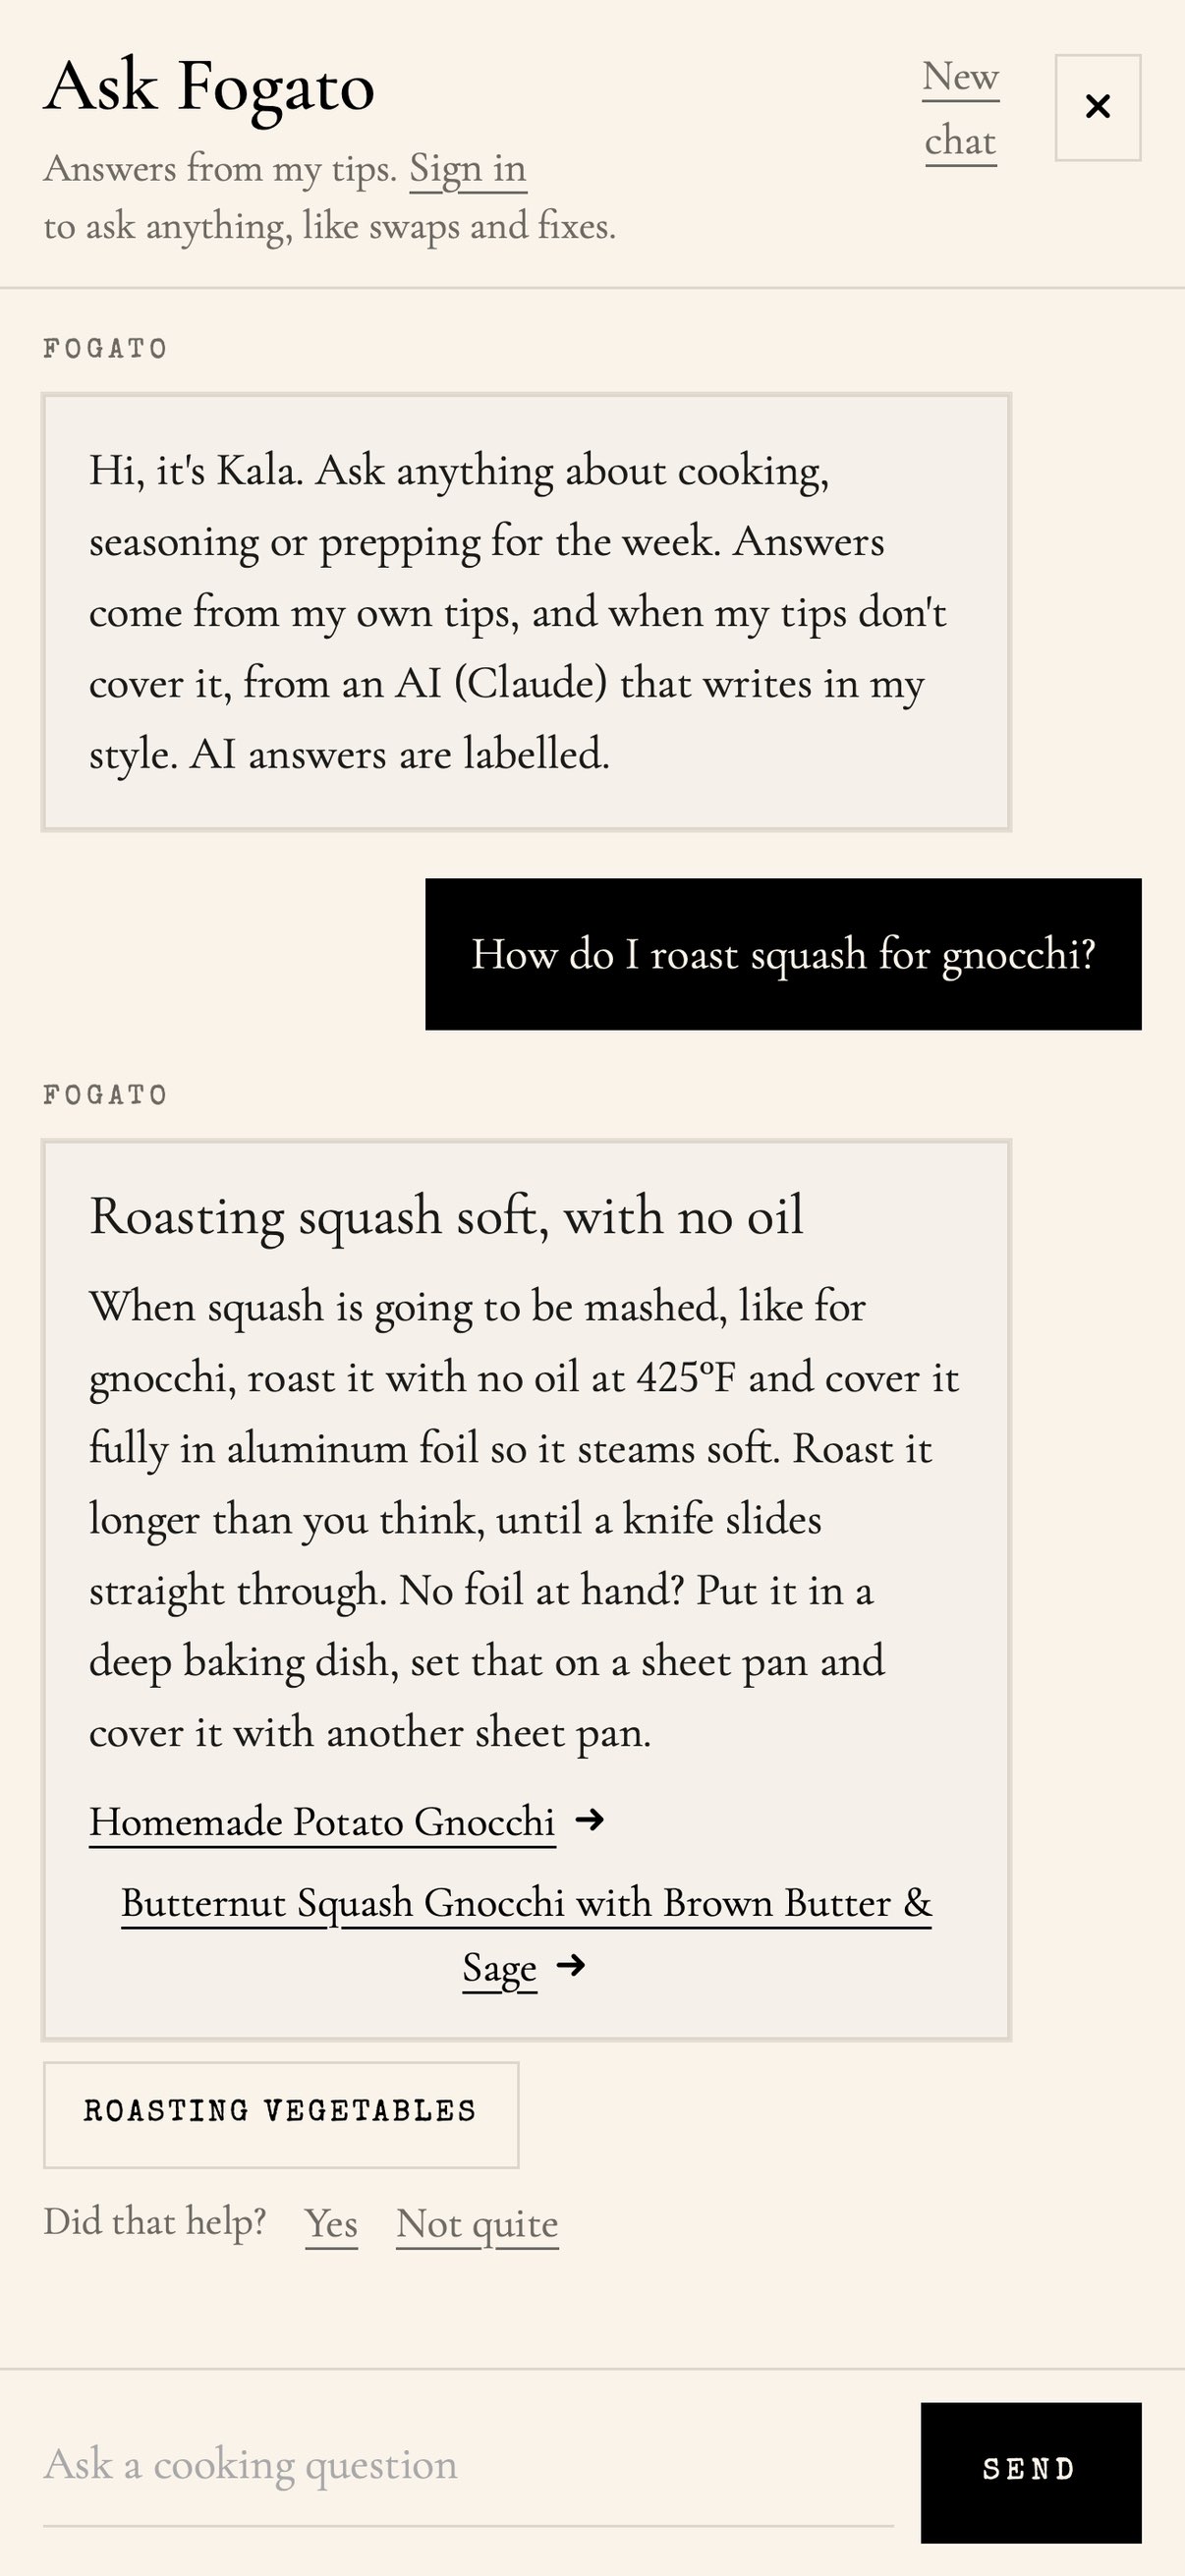
An iPhone and web cooking app designed and built for Fogato LA: a taste quiz, recipe feed, cook-with-what-you-have and an Ask Fogato chat.
Built forhome cooks who want something to make tonight without scrolling through recipe blogs
02Airbnb Revenue Forecasting
Predictive modeling
03Client Metrics
Analytics platform
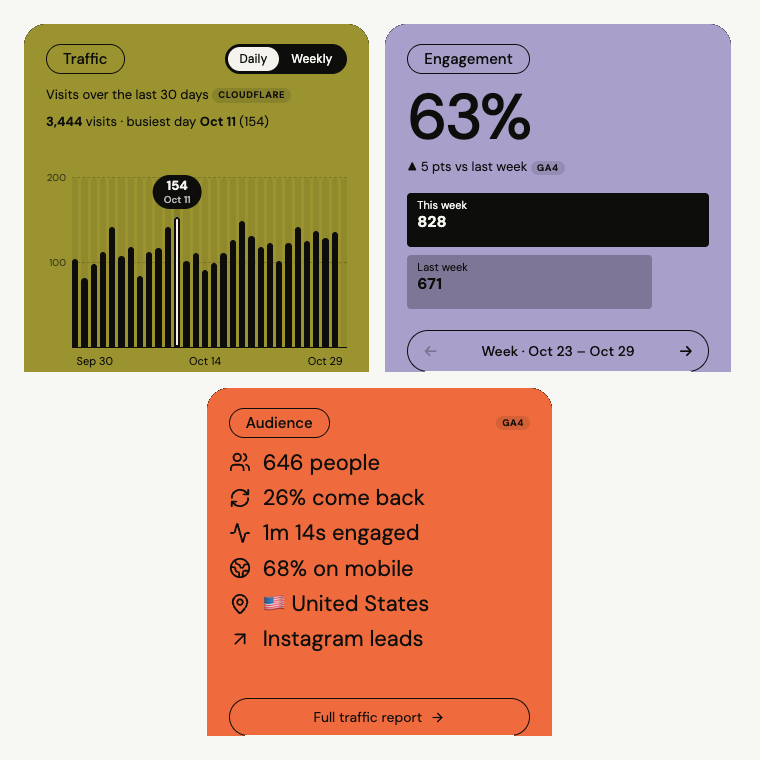
A private, multi-client analytics platform that turns raw Cloudflare Web Analytics and Google Analytics 4 data into one plain-language dashboard per client: visits, channels, top pages, audience and Core Web Vitals.
Built forsmall businesses and creatives who want to know what their website is doing without learning analytics tools
Pulls Cloudflare's GraphQL analytics and the GA4 Data API server-side, classifies every visit into channels (Instagram, organic search, AI assistants, email, referral…), merges sampled and full-resolution data so 30-day views stay accurate, and stores per-client encrypted credentials in D1. Each client signs in with their email and sees only their own workspace.
04Music & Mental Health
Statistical research
05Government Staff Pipeline
Automation pipeline
Turns government org charts and agency lists into CRM-ready leadership data using document parsing, web research, and AI. Teammates with less technical expertise needed it too, so the pipeline was packaged as an app they can run themselves.
Built forbusiness development and operations teammates who need clean leadership lists and would never touch a notebook
06LA Wildfire Risk & Housing
Interactive data story
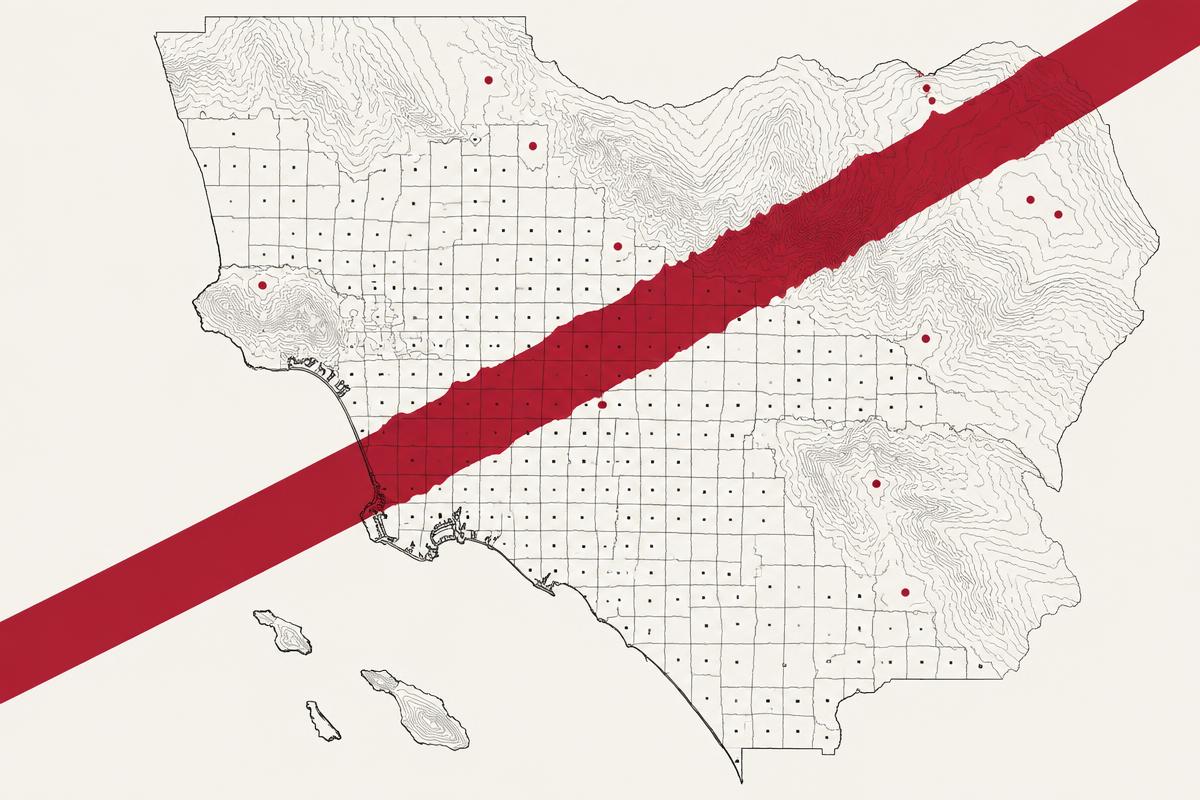
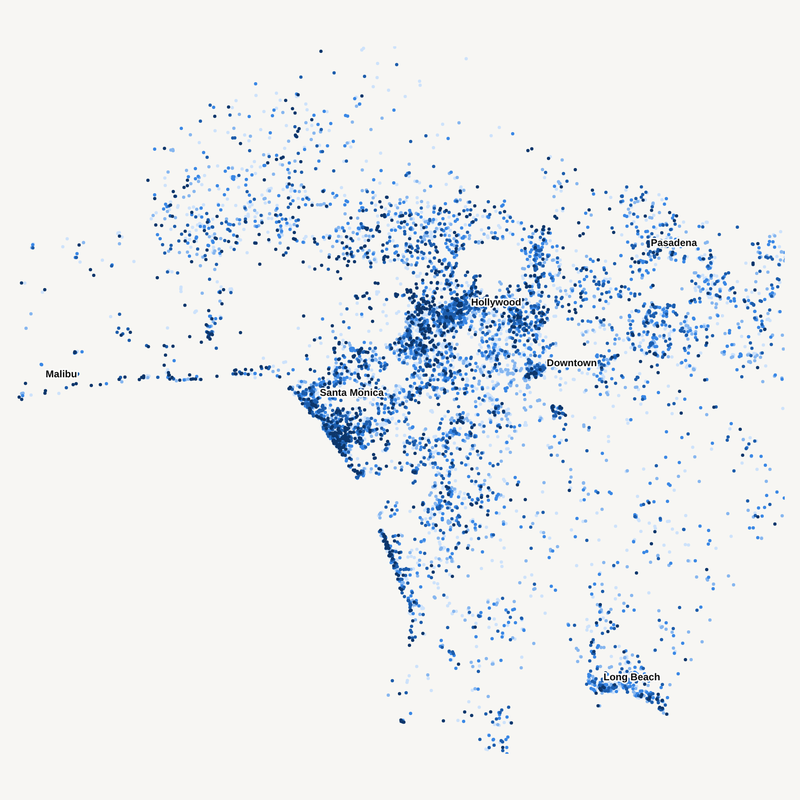
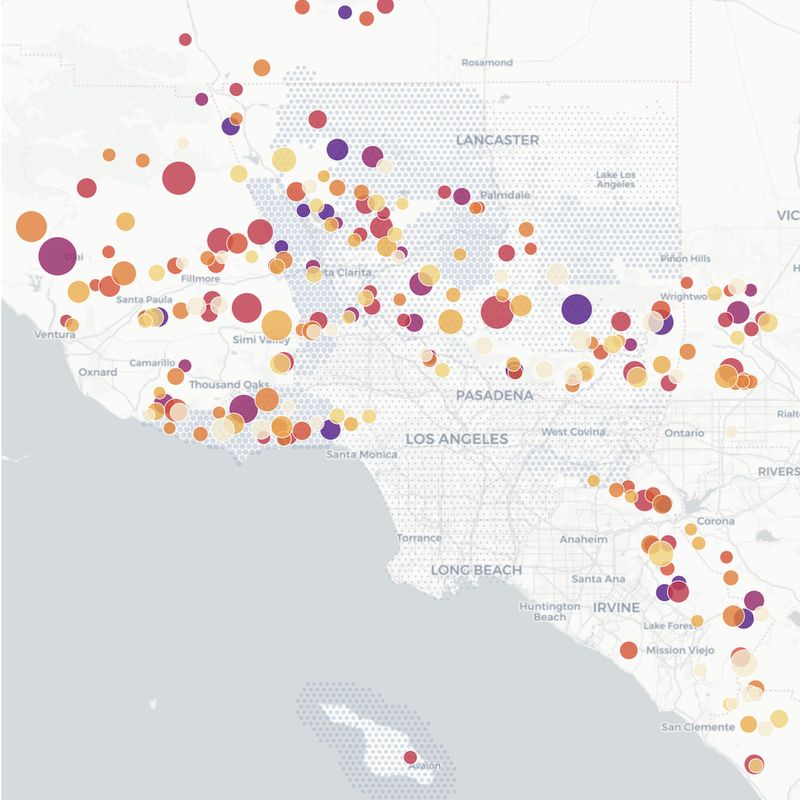
Compares CAL FIRE hazard zones, Zillow home values, and Census income across LA County ZIP codes in an interactive explorer of wildfire exposure versus real-estate performance.
Built forreal estate professionals and homebuyers who want to read wildfire risk and housing value side by side without opening a spreadsheet